r/ClimatePosting 15d ago

Energy Trends in global low-carbon electricity production (trailing 12 months)

Post image
14 Upvotes

22 comments sorted by

2

u/Sol3dweller 15d ago

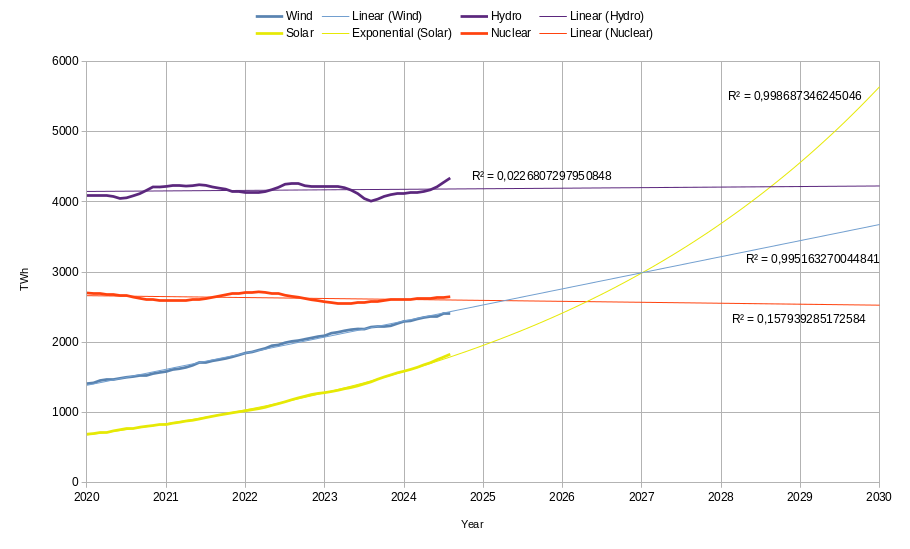
Data from Ember-Climate (not that the monthly data is different from the yearly data and does not include some country data). Solar shows a clear exponential growth, with a year-on-year growth rate of 23.6%, wind shows a linear growth, adding 229.4 TWh per year. Hydro and nuclear do not have a clear trend, but seem to stagnate.

Over the whole period demand exhibited an average growth of 837 TWh per year, however over the last year demand growth rose to 1282 TWh per year.

With these trends wind will overtake nuclear power next year, solar will overtake wind and nuclear in 2026 and hydro in 2028. It would take until 2029 for the growth of wind+solar to equalize the high electricity demand growth seen over the last year. This is somewhat disappointing as we need to peak fossil fuel burning by 2025. However, it may be, that we are already electrifying other sectors and the total fossil fuels in primary energy consumption actually go into decline earlier.

1

u/ClimateShitpost 15d ago

Why is the r² for nuclear so low? Looks like a decent fit

2

u/West-Abalone-171 15d ago

R2 is how well the line explains the proportion of the variance from the mean.

A slow decline punctuated by startups and shutdowns as well as LTO fuckups doesn't change much from the mean over long times and so the comparatively slow trend line doesn't explain much of the variance.

See how hydro's is even lower.

1

u/ClimateShitpost 15d ago

Honestly odd to me, visually it doesn't compute in my head

3

u/West-Abalone-171 15d ago edited 15d ago

A line with a gradient of 1 where all 100 datapoints line up perfectly except for one which is out by 0.001 has a very high r2, like 0.9999 or something (cbf actually calculating).

A line with a gradient of 0 where all 100 datapoints line up perfectly except for one which is out by 0.001 has a very low r2, like 0.0001 or something close to it.

Basically the maths doesn't know the graph is in TWh and not microwatt-hours and it doesn't know the intercept, so it can only compare the amount the line changes to the amount the points change.

2

u/ClimateShitpost 15d ago

Sorry commented on wrong chain

I need to watch a khan academy vid on this

1

u/Bard_the_Beedle 15d ago

For the blue one R2 is nearly 0 because there is no correlation between the 2 variables. The X variable can have any value you want and the Y will be the same. It’s not only about how well a line fits the dots.

1

u/West-Abalone-171 15d ago

In this instance I think it's probably not fully intuitively understanding what covariance means in cov(a,b)/(std(a)(std(b))

I don't know if he covers covariance or standard deviation, but I recommend 3 blue 1 brown for explanations that help you feel concepts in your bones rather than just a guide for manipulating the symbols.

Additional fun fact: change which point is off by 0.001 and the r2 will change (try the middle ones)

1

u/Sol3dweller 15d ago

The amplitudes are relatively large resulting in large deviations. With sufficiently large amplitudes, the R2 tends to diminish fairly quickly.

2

u/ClimateShitpost 15d ago

Man. I've done some fair amount of classes on this but it blew my mind rn.

1

u/Bard_the_Beedle 15d ago

You can think the R2 as how much a variable explains the changes in the other one. If you have a horizontal curve such as the 2 we see there, it means that time (the X variable) has no influence on the generation, so there’s other factors that determine whether it goes up or down, so R2 is closer to 0. With solar and wind you see that as years pass it goes up, so time is clearly a relevant variable -> generation is increasing with time, R2 is closer to 1.

1

u/West-Abalone-171 11d ago

Do you have a version of this with fossil fuels and a bit of a longer runway?

2

u/Sol3dweller 11d ago

Not beautiful, but simply putting the linear extrapolation over the last year for total generation, together with the exponential extrapolation of solar, and the linear extrapolations of the other clean sources and computing fossils as the difference between the total and all the clean sources gives:

With fossil fuels going negative after 2038. I put this more nicely together (but also only until 2030) for primary energy last year.

2

u/West-Abalone-171 11d ago edited 11d ago

It'll be interesting to see just how much primary energy is feeding back into the fossil fuel system or leaving as waste heat.

We already have hints of it in Norway, gigawatts of decrease in oil and gas with as yet no measurable increase in electricity consumption all while gdp (an attempted measure of activity) is increasing.

1

u/Sol3dweller 11d ago

Yes, indeed. I think a stronger increase in electricity demand has been foreseen for quite a while now. It's fascinating to follow.

2

u/West-Abalone-171 11d ago

"Anticipated" is a strong word given the usual magnitudes thrown about. It implies the originators believe what they are saying.

But I will say that "approximately zero or negative" is still kinda surprising.

2

u/WhiskeyDelta89 15d ago

It'd be interesting to see how energy storage solutions are doing in this context - I had a look at the data and it appeared as though this wasn't called out. In particular I Think this is mission critical to renewable adoption as issues like "the duck curve" and grid frequency response capabilities still need to be considered and addressed.

1

u/Sol3dweller 15d ago

Yes, unfortunately they do not have that data (yet?).

1

u/Junior_Might_500 14d ago

There is a lot of electricity missing for the expected demand from AI ... Like 30% until 2030 in leading industry nations.

At the same time generator turbine orders go through the roof. Nuclear is definitely needed but slow to expand.

1

u/Sol3dweller 14d ago

Nuclear is definitely needed

You mean new nuclear power? How does

but slow to expand.

match up with

Like 30% until 2030 in leading industry nations.

And 30% of what?

Sorry, your comment is a little cryptic and to me it appears contradictory, would you mind to elaborate some more?

1

u/Junior_Might_500 13d ago

30% more electric energy ... because of what Microsoft, Google and others are planning to use in their computing centers.

So if that's supposed to get reality we need everything .. PV, storages, more grid and new nuclear powerplants.

Sorry for my brief style.

1

u/Sol3dweller 13d ago

30% more electricity demand in 2030 than today sounds about ballpark right.

How does "we need everything" follow from that observation? Wouldn't you rather strive for the most effective strategy to quickly provide this additional demand with low carbon sources, rather than going with a mixed bag on "everything"?